As of this week, the light and dark maps in Cuando are ours. The data is OpenStreetMap's; the pictures are drawn by our own server, from our own styles, and stored with Cloudflare. Satellite still comes from Mapbox. If you use the app and didn't notice anything, that was the plan.
This is the story of how we got here. Looking back over the last six months, every decision we made about the map followed from one thing: how the map was billed.
Five days of the real thing
The very first map, in August, was Mapbox's own Flutter SDK. Native, vector, smooth: the proper way to put a map in an app.
It lasted five days. The reasons were boring. The plugin didn't run in the web build, where desktop browsers got a polite "not yet supported by the maps plugin", and we want one codebase for Android, iOS and the web. The Android build also needed a special download token from Mapbox, and we had the wrong kind.
So we switched to flutter_map, which runs everywhere because it does something very simple: it lays out square pictures of the map, called tiles, in a grid, and fetches new ones as you pan and zoom. The pictures came from Mapbox: their Navigation Day style for light mode, Navigation Night for dark, plus Streets and Satellite.
The arithmetic
Two weeks later we did the maths, and wrote it up in an issue proposing we go back to the SDK. Mapbox bills the two in completely different ways:
- The mobile SDK is billed per monthly active user, and the first 25,000 a month are free.
- Static Tiles, the pictures flutter_map was showing, are billed per request, and the first 200,000 requests a month are free.
That sounds like a lot of requests until you count them: every pan and every zoom asks for a fresh screenful of tiles. In the issue's own words: "we would run out of Static Tiles 200k/month requests allowance before we even get any users."
If anything, that was optimistic. The three of us used up the free monthly quota with ease, just testing, and from then until this week we paid Mapbox $10–30 a month for an app that barely had any users. On the SDK, three people would have cost nothing. But we'd just left the SDK for good reasons. Making the tiles twice as big (512 pixels instead of 256), so a screen needs a quarter as many, took the edge off. The real fix was to stop paying per tile altogether.
The week we tried vector
The obvious fix is vector tiles. Instead of pictures, the server sends the map as data, roads and buildings and labels, and the phone draws it. The tiles are tiny, a style change is a JSON edit, and the labels stay upright when you rotate the map.
In November we tried it with flutter_map's vector tile module, on mobile only (the web stayed on pictures). It worked, technically, on both platforms. On an iPhone it was fine. On Android the map lagged and stuttered, and you could watch it draw itself in, tile by tile.
A bus app gets opened at a bus stop, on whatever phone you have, and a lot of those phones are mid-range Androids. A week later vector was gone.
Don't draw what nobody looks at
So pictures it is. Pictures have one nasty property: every zoom level has four times as many tiles as the one before it. The street level most people want, around zoom 18 or 19, is where nearly all of the tiles are.
But most of our region is scrubland, farmland, two salt lakes (one of them pink) and the sea. Nobody needs to see a salt lake at zoom 19. Nobody should be able to ask for it, either: every tile you can ask for is a tile someone has to fetch, pay for or draw.
So on February 12 the server started computing a zoom grid. It's a coarse grid laid over the region, and each cell holds one number: how far in you're allowed to zoom there. The rules are simple:
- Everything starts at zoom 13, which is enough to see where the towns are.
- A cell with a bus stop within a couple of kilometres of its centre goes all the way to 22, and its neighbours get 16.
- A cell that a bus route passes through gets 16, and its neighbours about 15.
- The stronger value always wins. A cell never gets lowered.
The grid ships to the app as a small protobuf file. The app looks up where the middle of the screen is and caps the zoom there, interpolating between neighbouring cells so the limit slides instead of snapping. It also can't pan out of the region any more.
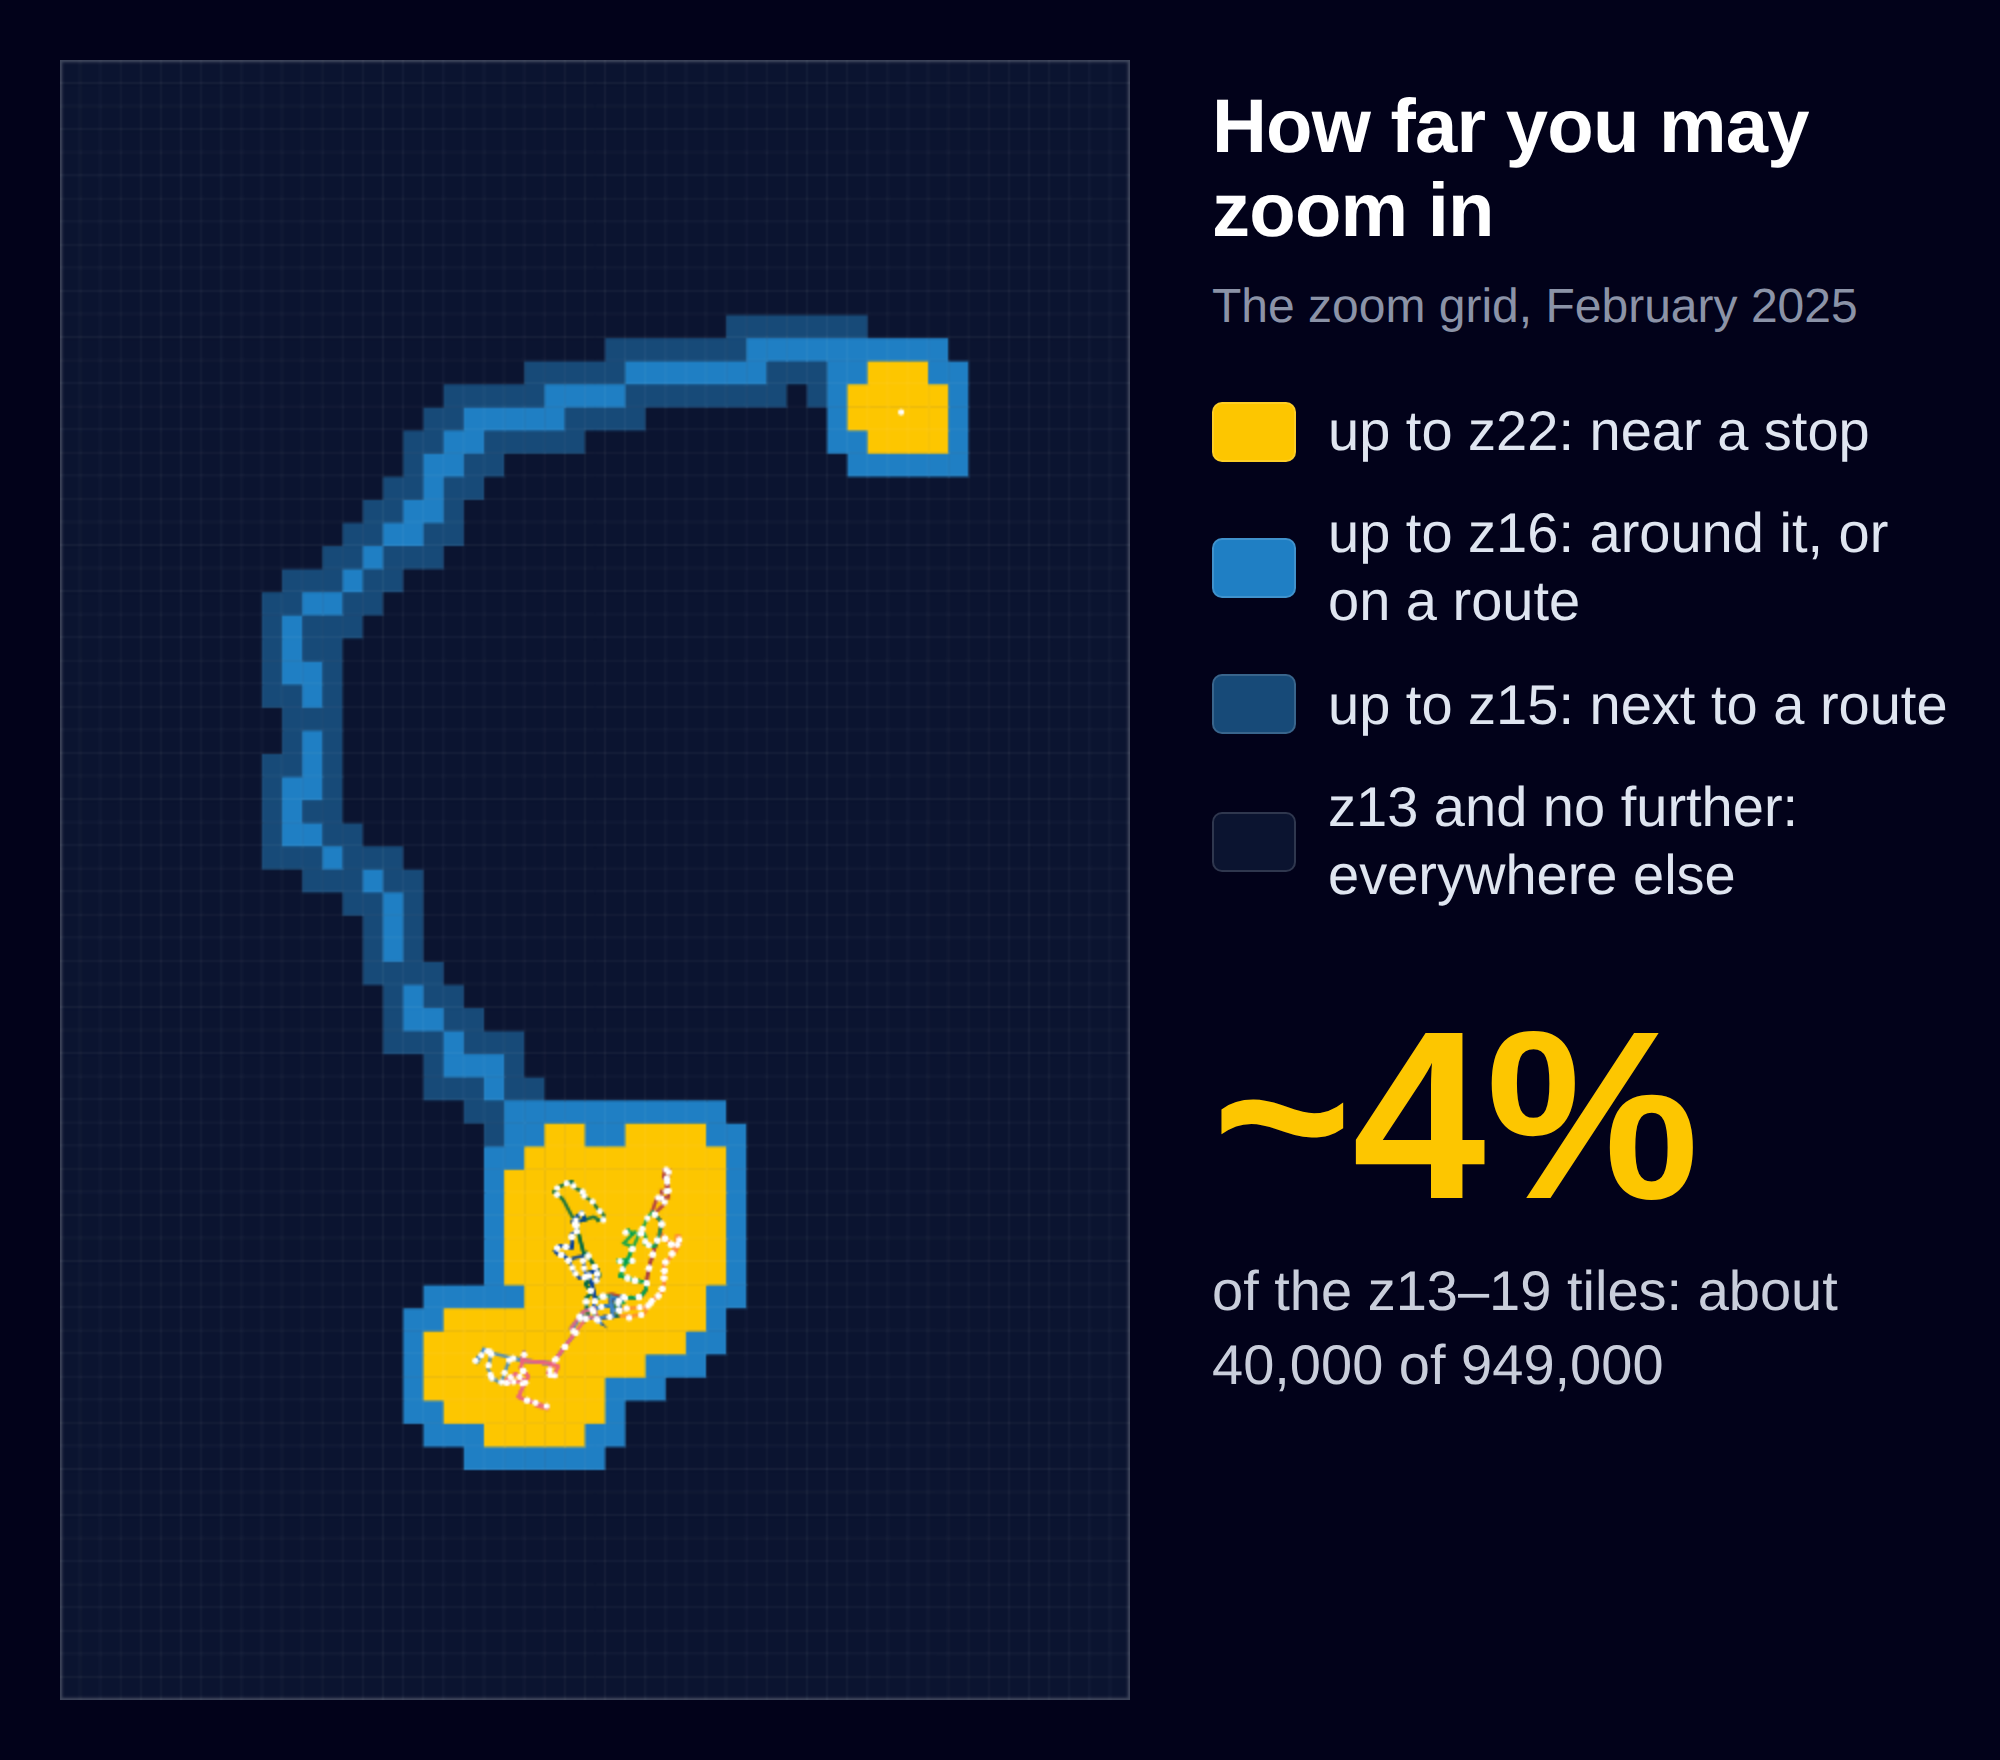
That's 54 × 72 cells of roughly 800 metres over about 2,560 km², and only 452 of its 3,888 cells allow anything past zoom 13. Count the tiles between zoom 13 and 19 whose centre sits where the grid allows that zoom, and it's about 40,000 out of 949,000: roughly 4%, or 24 times fewer than the full pyramid.
Most of the time went into tuning it: how far around a stop you should be able to zoom all the way in, how wide a route's corridor should be, and where "enough" is for a town you're only passing through.
Having this grid is what made the next step thinkable.
Drawing our own
On February 14 we started a map server of our own. The first evening had two approaches side by side:
- the standard kit: tilemaker to cut OpenStreetMap data into vector tiles, and tileserver-gl to serve them and render pictures from them;
- a forty-line script that rendered a single tile with MapLibre Native directly. tileserver-gl renders with MapLibre Native under the hood anyway.
tilemaker stayed for the data. The script won the other half. Three days later it was a small Express server, and by the end of the week the heart of it looked like this, trimmed a little:
app.get('/tiles/:style/:size/:z/:x/:y', async (req, res) => {
  // …parse z, x, y and the size…
  const center = mercator.ll([(x + 0.5) * 256, (y + 0.5) * 256], z)

  const map = new maplibre.Map({ ratio: 1.0 })
  map.load(styles[req.params.style])

  map.render({ zoom: z, center, width: size, height: size }, (err, rgba) => {
    map.release()
    const png = new PNG({ width: size, height: size })
    png.data.set(rgba)
    res.set('Content-Type', 'image/png')
    png.pack().pipe(res)
  })
})
Every request builds a fresh map, points a 512-pixel window at the centre of the tile you asked for, renders it, and sends back a PNG. MapLibre Native is the same C++ renderer that's inside MapLibre's mobile SDKs, and it wants an OpenGL context. A server has no screen, so the whole thing runs under Xvfb, a virtual display, in a container.
The styles are adapted from OpenMapTiles' Positron for light and Dark Matter for dark. We tried a few others along the way (OSM Bright, Liberty, an outdoor one, a night one) and kept Positron and Dark Matter, which are designed to sit quietly under whatever you draw on top.
And here's the funny part. The renderer's input is a vector map of the region that our own API already serves: OpenStreetMap, cut into vector tiles by tilemaker. So we have a perfectly good vector map, and a server that turns it into pictures, because the phones can't draw it fast enough. I'm aware.
In front of the renderer is a Cloudflare Worker, and it's the only thing that can reach the renderer. For each tile it checks R2, Cloudflare's object storage, first. On a miss it asks the renderer, sends the PNG back to the phone and keeps a copy in R2 on the way. So every tile is drawn exactly once, by whoever looks at it first.
That matters, because drawing is slow. The box it runs on takes about three seconds to render a tile and can handle about four at once. The first person to zoom into a new street waits, and everybody after them doesn't. With a million possible tiles that would be a very long wait. With forty thousand it's fine.
The switch
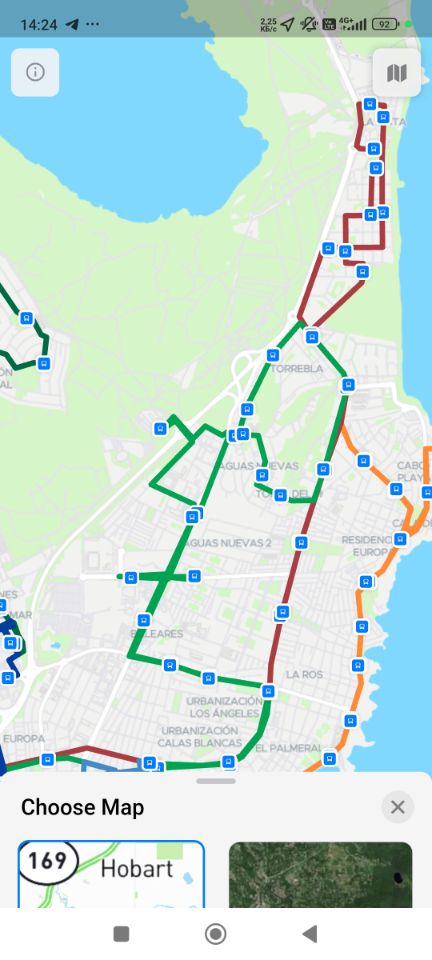
On the app side, the switch was almost boring. On purpose: our tile URLs have the same shape as Mapbox's, /{style}/512/{z}/{x}/{y}@2x, so for flutter_map the new map is a different URL template and a different access token.
Each style now knows who provides it. Light and dark are ours. Satellite stays with Mapbox, because we have nothing to draw it from. Streets is gone. And the Mapbox logo only shows when you're looking at Mapbox's tiles. Our Flutter developer shipped the last of it just before two in the morning, which I'm told is the traditional time.
What it costs
- Money: Mapbox, for satellite only. R2 storage and Worker requests come to pennies. The renderer runs on a small VM we already had.
- Time: three seconds for the first person to see a tile nobody has seen before.
- Changing the look: this is the real price. A picture has its style baked in. Changing a colour means throwing away every tile we've stored and drawing them all again, and that goes twice, because there are two themes.
What's next
- Drawing ahead of time, so nobody waits the three seconds. The zoom grid tells us exactly which tiles to draw.
- Logging which tiles people actually ask for, and whether they came from storage or had to be drawn. That goes in tomorrow.
- Vector, one day. The map is already vector on the server. It's the phones that need convincing.
- The timing worked out. By the time we properly started telling people about Cuando, every map in it except satellite was ours.
- The pictures are still there. The Flutter app draws our raster tiles to this day, and the zoom grid still ships with it. It's generated by the API now, over a bigger area, and got a tab in our admin console just for tuning it.
- Drawing ahead of time came in April 2026. Zoom 13 to 19 over the grid's box is 944,382 tiles per theme. The VM would need about eight days per theme, so the prerender runs on my Mac mini instead: 10 to 12 hours per theme, about 15 GB each. The VM only draws what's missing.
- Vector won anyway, just not in Flutter. The whole region as one vector archive (a PMTiles file) is 58.67 MB. That's about 255 times smaller than one raster theme, and it serves every theme at once: a new theme is a 22 KB style file. A Worker serves it straight out of R2, reading only the bytes each tile needs, with no render box at all. Past the archive's deepest zoom the phone simply scales up the vector data, so a vector map doesn't need the zoom grid either.
- Where it's used: our admin console moved to MapLibre in May 2026. The new apps, rewritten in Swift with Skip, draw vector maps: MapLibre on our tiles on Android, Apple's MapKit on iOS.
- Flutter got one more vector attempt in 2026, with GPU rendering switched on. It crashed outright on a mid-range Redmi. That's the story for the second maps post.
- The zoom limit never slid. The app turns the position into whole cell numbers before it "interpolates" between them, so it always reads exactly one cell and the limit snaps after all. Nobody noticed for a year and a half.
- Satellite, the last thing we took from Mapbox, left the map picker in August 2026.